Decoding Football Betting Odds: How Lines Shape the Global Betting Landscape
Written by Uma Schulz · Mar 26, 2026
Decoding Football Betting Odds: How Lines Shape the Global Betting Landscape
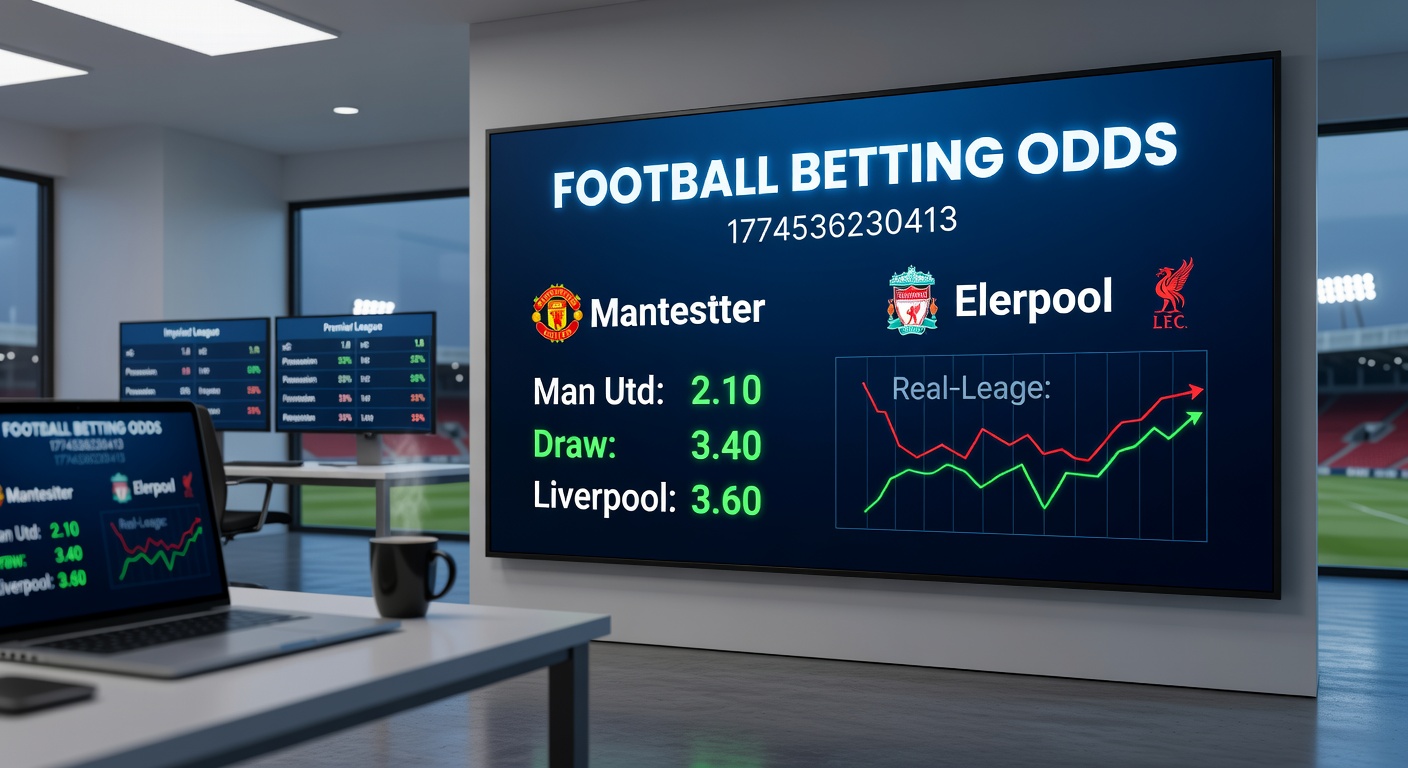
Football betting odds serve as the backbone of the wagering world, transforming statistical probabilities into numerical invitations for punters across continents; these figures, crafted by bookmakers through intricate algorithms and market dynamics, dictate everything from casual flutters to high-stakes accumulators, while revealing deeper insights into team strengths, fixture complexities, and even crowd sentiment.
What's interesting is how odds evolve in real-time during matches, reflecting live events like goals or red cards, yet they all stem from the same foundational principles that bookmakers refine daily. And as European leagues hit their stride in March 2026, with Champions League knockouts looming and domestic cups intensifying, observers note sharper lines emerging from piled-up fixtures and transfer rumors.
The Core Formats of Football Betting Odds
Bookmakers present odds in three primary formats—decimal, fractional, and American—each tailored to regional preferences, although decimal odds dominate globally for their straightforward multiplication to yield payouts. Decimal odds, common in Europe and Australia, express the total return per unit staked; for instance, odds of 2.50 mean a $10 bet returns $25, including the stake, while fractional odds like 3/2 (prevalent in the UK) indicate profit relative to stake, so that same $10 bet profits $15.
American moneyline odds flip the script for favorites and underdogs: a minus sign like -150 signals the amount needed to win $100, whereas +200 shows potential profit on a $100 wager. Converting between formats proves simple with formulas researchers have standardized; data from sports analytics platforms reveals most bettors favor decimals for quick calculations, especially in fast-paced live betting scenarios.
- Decimal: Total payout = Stake × Odds
- Fractional: Profit = Stake × (Numerator/Denominator)
- Moneyline: For positives, Profit = Stake × (Odds/100); for negatives, Profit = Stake × (100/|Odds|)
Turns out, understanding these conversions unlocks cross-market opportunities, as punters arbitrage slight discrepancies between bookies using different formats.
How Bookmakers Construct and Adjust Odds
Teams of traders and algorithms set initial odds by crunching vast datasets—historical head-to-heads, player stats, home advantage metrics, and even weather forecasts—then layer in a bookmaker's margin, known as vigorish or juice, typically 5-10% to guarantee profitability over volume. Figures from the Nevada Gaming Control Board show soccer markets often carry lower vig around 4-6%, thanks to high liquidity from global interest.
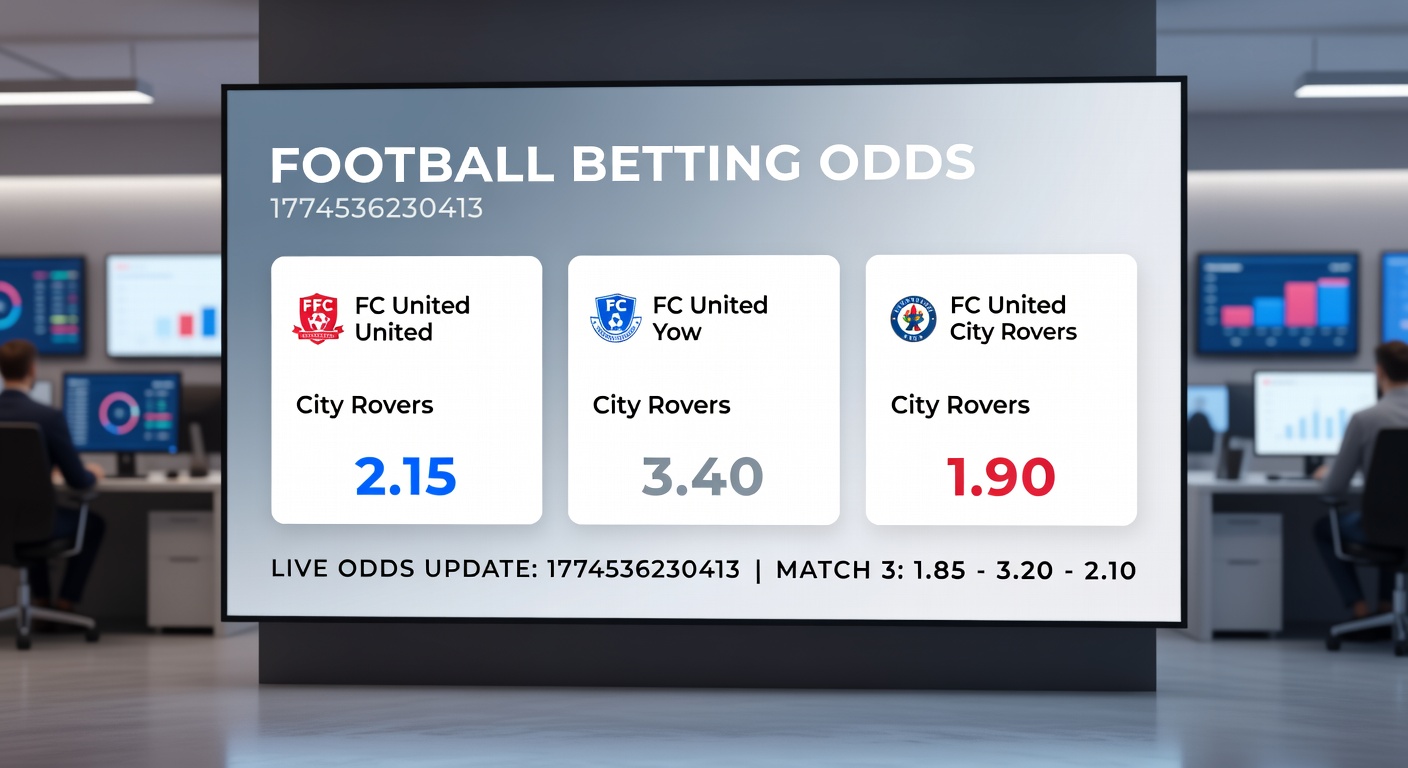
But here's the thing: once markets open, public money flows in, prompting sharp adjustments; heavy backing on a favorite shortens those odds, lengthening the underdog's to balance the book, while limiting exposure on lopsided bets. Experts observe this "steam" effect most vividly in major leagues, where a star striker's last-minute injury can swing lines by 20-30% within minutes.
Live odds take this dynamism further, recalculating every few seconds based on in-play metrics like possession percentages or expected goals (xG); studies indicate these micro-adjustments capture over 80% of match variance, offering bettors edges in momentum shifts.
Implied Probability: The Hidden Math Behind the Odds
Every set of odds embeds an implied probability, calculated as 1 divided by decimal odds (or adjusted for fractional/moneyline equivalents), revealing the bookmaker's estimated chance of an outcome minus the vig. So 2.00 odds imply a 50% probability, but with a 105% overround across three-way markets (home/draw/away), the true fair odds sit lower, creating that bookmaker edge.
Researchers who've dissected thousands of lines find skilled bettors hunt "value" where their assessed probability exceeds the implied one; take a match where data suggests a 40% underdog win chance against bookie-implied 30% (say 3.33 odds), and positive expected value emerges. This math underpins successful strategies, although closing line value—beating the final odds—proves the ultimate benchmark per industry benchmarks.
It's noteworthy that in March 2026, with AI-driven models from firms like Opta feeding bookies unprecedented data granularity, implied probabilities grow ever tighter, squeezing casual edges while rewarding those who layer in qualitative factors like managerial tactics.
Key Football Markets and Their Odds Structures
Beyond straightforward match odds, football offers layered markets where odds reflect nuanced scenarios; over/under goals lines hover around 2.5 for most fixtures, with odds balancing historical scoring rates against defensive setups, while Asian handicaps eliminate draws by quarter- or half-goal adjustments, popular in Asia for tighter margins.
Player props—anytime goalscorers or cards—carry steeper vigs yet explode in appeal during derbies; one analysis of Premier League seasons uncovered that top strikers' anytime scorer odds average 2.80, but drop sharply post-hot streaks due to public overbetting. Accumulators multiply odds across selections, amplifying payouts but ballooning risk, as a single leg failure voids the lot.
And now, with esports football simulations gaining traction, virtual match odds mirror real ones, processed by RNGs for round-the-clock action; data shows these fill gaps during international breaks, maintaining steady bookmaker revenues.
Factors Driving Odds Movements Across Leagues
Form streaks dictate short-term swings—a three-game win run can halve home odds—while injuries to pivots like midfield maestros send ripples through both team and prop lines; weather plays a subtler role, muting goal totals in sodden pitches, as evidenced by Bundesliga data during rainy spells.
Public bias tilts odds too: favorites draw recreational money, lengthening underdog value, a pattern research from the Australian Institute of Family Studies confirms in global soccer markets. Fixture congestion, especially in March 2026's congested schedules blending league, cup, and continental ties, forces rotations; observers track how odds lengthen for fatigued squads, creating exploitable inefficiencies.
Global events like World Cup qualifiers inject volatility, as national duty disrupts club rhythms; yet bookies counter with hedging across correlated markets, keeping overrounds stable.
Trends Shaping Football Odds in 2026
Live betting volumes have surged past 70% of total soccer wagers, per industry trackers, fueled by mobile apps delivering sub-second odds updates; crypto bookies introduce borderless lines with minimal vig, attracting tech-savvy punters, although regulatory scrutiny tempers growth.
AI and machine learning refine opening lines to near-perfection, incorporating social media sentiment and referee tendencies; one case saw models flag a 15% edge on draw-no-bet markets by blending xG with lineup news. Sustainability factors creep in too—carbon-conscious leagues influence travel-weary odds—while women's football markets mature, with odds mirroring men's in liquidity for top clashes.
People who've tracked this evolution note how exchange platforms like Betfair flip traditional models, letting punters bet against each other for commission-only vig, often yielding superior odds.
Wrapping Up the Odds Game
Football betting odds encapsulate a blend of data science, psychology, and market forces, evolving from static pre-match numbers to hyper-responsive live entities that mirror the game's unpredictability; those who master implied probabilities, vig awareness, and movement patterns navigate this landscape effectively, turning lines into informed decisions amid March 2026's feverish fixtures.
Ultimately, while bookmakers hold the edge through volume and precision, the thrill lies in spotting fleeting values where stats and instinct align, ensuring football's betting theater remains as captivating as the pitches themselves.